Primary research
Interviews
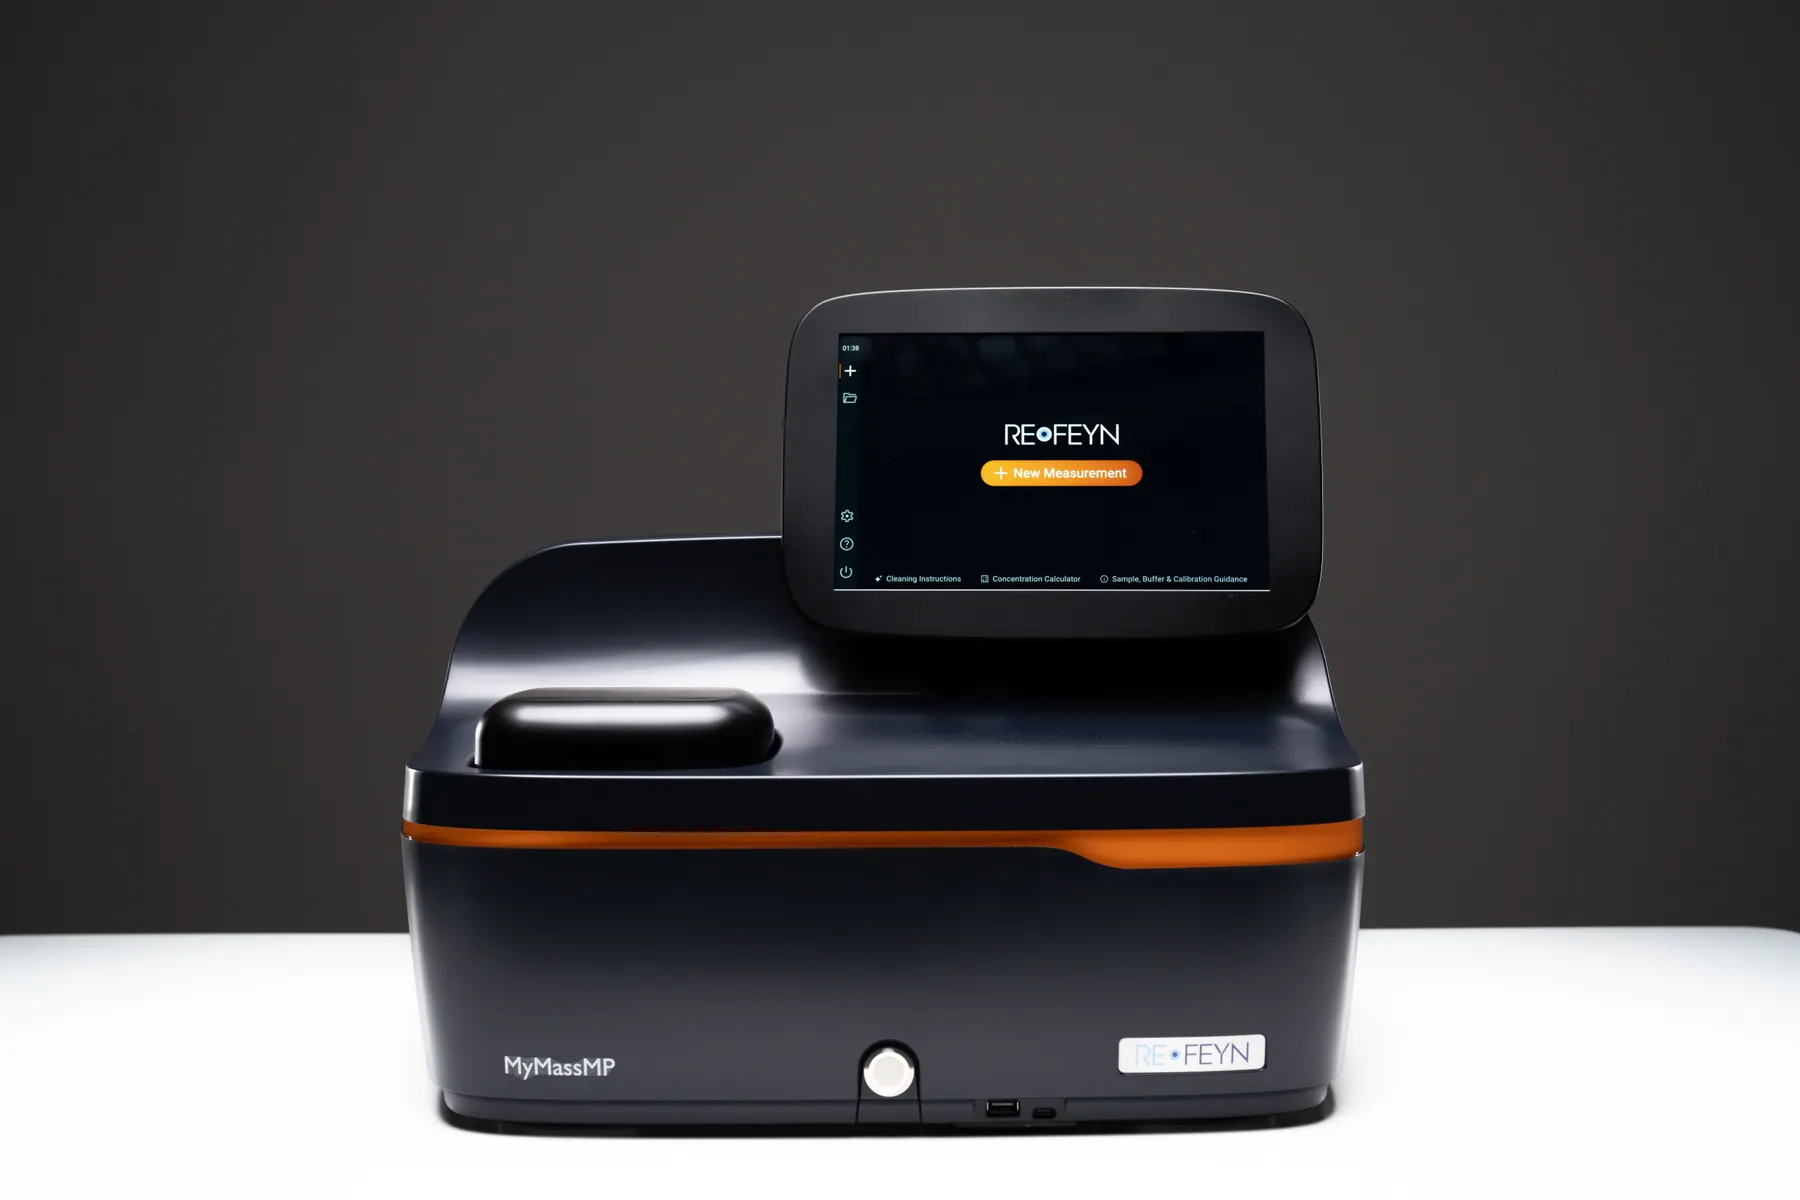
Refeyn / Scientific Instrument / MyMass
As Product Design Lead, my work went beyond the interface. With Product Management, I shaped the complete MyMass experience, from unboxing and installation to guided measurements, support, telemetry, consumables, and follow-up.
01 - My Role
I led the end-to-end UX for MyMass, from discovery research through definition, workflows, wireframes, prototypes, touchscreen interaction design, testing, high-fidelity delivery, and ongoing support for the software team.
Primary research
Interviews
UX vision
Personas
Pain points
Journey maps
Workflows
Wireframes
Prototypes
Touchscreen components
High-fidelity designs
Usability testing
Alpha testing
Service testing
Iterative software support
Design system documentation
SAT definition, cleaning instructions, and training videos.
Branding, messaging, photography, and launch video direction.
Usability and subscription model thinking for slides, carriers, and calibrants.
Clear, labelled packaging for a smooth unboxing experience.
Telemetry metrics to inform continuous improvement.
Post-delivery check-ins, post-SAT surveys, and 6-month follow-ups.
02 - Business Opportunity
Cryo-EM users need a fast, affordable way to check sample quality before booking imaging sessions. These sessions can cost over $5,000 and have waiting lists of two months or more.
Existing options were too slow, too expensive, or did not provide enough information about the protein complex. The brief was to design an instrument that lets researchers check a sample in minutes before committing to cryo-EM.
04 - Discovery
We ran in-depth interviews with cryo-EM users, academic and pharma researchers, the sales team, and lab technicians. I focused on how teams check samples today, what makes them trust a result, and what stops them adopting new equipment.
Cryo-EM users
Academic and pharma researchers
Sales team
Laboratory technicians
Sample-checking workflows and pain points
Trust factors in experimental research
Device accessibility and adoption barriers
A product vision
Three primary personas
An end-to-end user journey
The Vision
One box. One piece of software. Minimal training. A small footprint, an affordable price, so checking samples becomes routine.
05 - Personas
Three primary user types emerged from the research, each with different pressures and goals.
06 - User Journey
I mapped the journey across three phases, covering user goals, actions, business goals, emotions, pain points, and design opportunities.
Receive parcel in perfect condition.
Track delivery, inspect packaging.
Deliver in time, ensure intact shipment.
Curious, expectant.
Damaged or delayed parcel.
Reinforced packaging, unboxing checklist, QR link to Getting Started page.
Set up easily without needing IT or engineering help.
Follow printed and video guide, stickers, connect instrument.
Reduce onboarding friction and create a professional unpacking experience.
Slightly anxious.
Confusion or overly technical steps.
Clearly labelled packaging and printed setup materials.
Confirm the instrument works correctly and is covered by guarantee.
Follow guided SAT workflow, perform test measurements, send results.
Validate instrument functionality and delivery success.
Focused, slightly nervous.
Unclear steps, failed SAT due to sample prep or user errors.
Guided SAT workflow, progress bar, videos, support link, pass/fail summary.
Successfully perform first valid calibration.
Dilute calibrant and run a calibration.
Demonstrate reliability and ease of use.
Satisfied.
User unaware of calibration need, dilution, or consumable assembly.
Guided workflow with instructions, videos, illustrations, and FAQs.
Understand cleaning frequency and method.
Follow instructions after four measurements.
Establish proper cleaning habits.
Careful, cautious.
Using wrong cleaning material or not cleaning properly.
Step-by-step cleaning guide with icons and reminders.
Validate own sample and compare to expected outcome.
Load known sample, analyse, interpret result.
Reinforce trust in measurement quality.
Excited, expectant.
Misinterpretation of peaks, bubbles, low confidence, concentration issues.
Automated warnings, recording, clear peak statistics, FAQs and instructional videos.
Quick, reliable calibration.
Calibrate every session.
Sell calibrants and provide accurate results.
Focused.
Old calibration or wrong buffer calibration.
Warnings for old calibration and calibrant dilution guidance.
Maintain performance.
Run cleaning protocol.
Extend instrument life.
Routine.
Forgetting cleaning, damaging the objective.
Cleaning reminders and cleaning instructions.
Run consistent measurements.
Assemble sample carrier and load sample.
Ensure reproducibility.
Confident.
Sample prep errors.
Step-by-step guided loading.
Understand peaks and trust results.
Use software visualisation.
Build trust in instrument data.
Uncertain.
Misinterpretation and unclear confidence.
Smart hints, confidence intervals, auto-labelling peaks.
Access, review, and organise stored measurements.
Browse previous runs, tag data, group by project or sample type.
Increase user engagement and repeat use.
In control.
Hard to find previous results.
Filtering, tagging, and advanced search functionality.
Identify changes easily.
Overlay or batch compare.
Encourage repeat use.
Engaged.
Too manual.
Simple UI to navigate past measurements.
Share with PI and colleagues.
Export or screenshot.
Spread adoption.
Proud.
Limited export formats.
Quick export of histogram and statistics table.
Always have what's needed.
Reorder slides, sample carrier, calibrant.
Sell consumables and ensure uninterrupted use.
Routine.
Forgetting to reorder, ordering delays.
Subscription model, auto-reminders, QR codes, low-stock notifications, e-shop.
Keep instrument reliable.
Subscribe to service, follow maintenance schedule.
Extend instrument lifetime.
Reassured.
Unclear maintenance status, instrument memory full.
Service reminders and storage management alerts.
Stay current with features and bug fixes.
Accept or schedule updates.
Improve UX and add capabilities.
Neutral.
Lack of internet connection or IT needed for updates.
Update notifications, scheduled reminders, and support for updating without IT.
Feel heard and valued.
Use telemetry, respond to surveys, or talk to Customer Excellence.
Gather actionable insights for product roadmap.
Appreciated, involved.
Feedback fatigue or unclear action from feedback.
Telemetry plus structured surveys, check-ins, You asked, we did updates, contextual surveys.
07 - Industrial Design
I worked with R&D, Operations, and an external industrial design consultancy on the instrument's form, ergonomics, and unboxing experience.
Friendly, functional, trustworthy
Cost-effective to manufacture
Visually consistent with the rest of the product family
Works for left- and right-handed users
Screen at standing height, tiltable
Smooth lid-closure mechanism
Dedicated place for magnets
08 - Workflows & Wireframes
I defined the core workflows with Product Management. The Site Acceptance Test (SAT) flow was developed with the Service team, so the data collected at install would confirm reliability and consistency.
09 - Early Usability Testing
I tested the wireframes with 8 participants, focused on three areas:
Touch interactions for gloved hands.
Guided workflows with progress indicators.
Error prevention with contextual help.
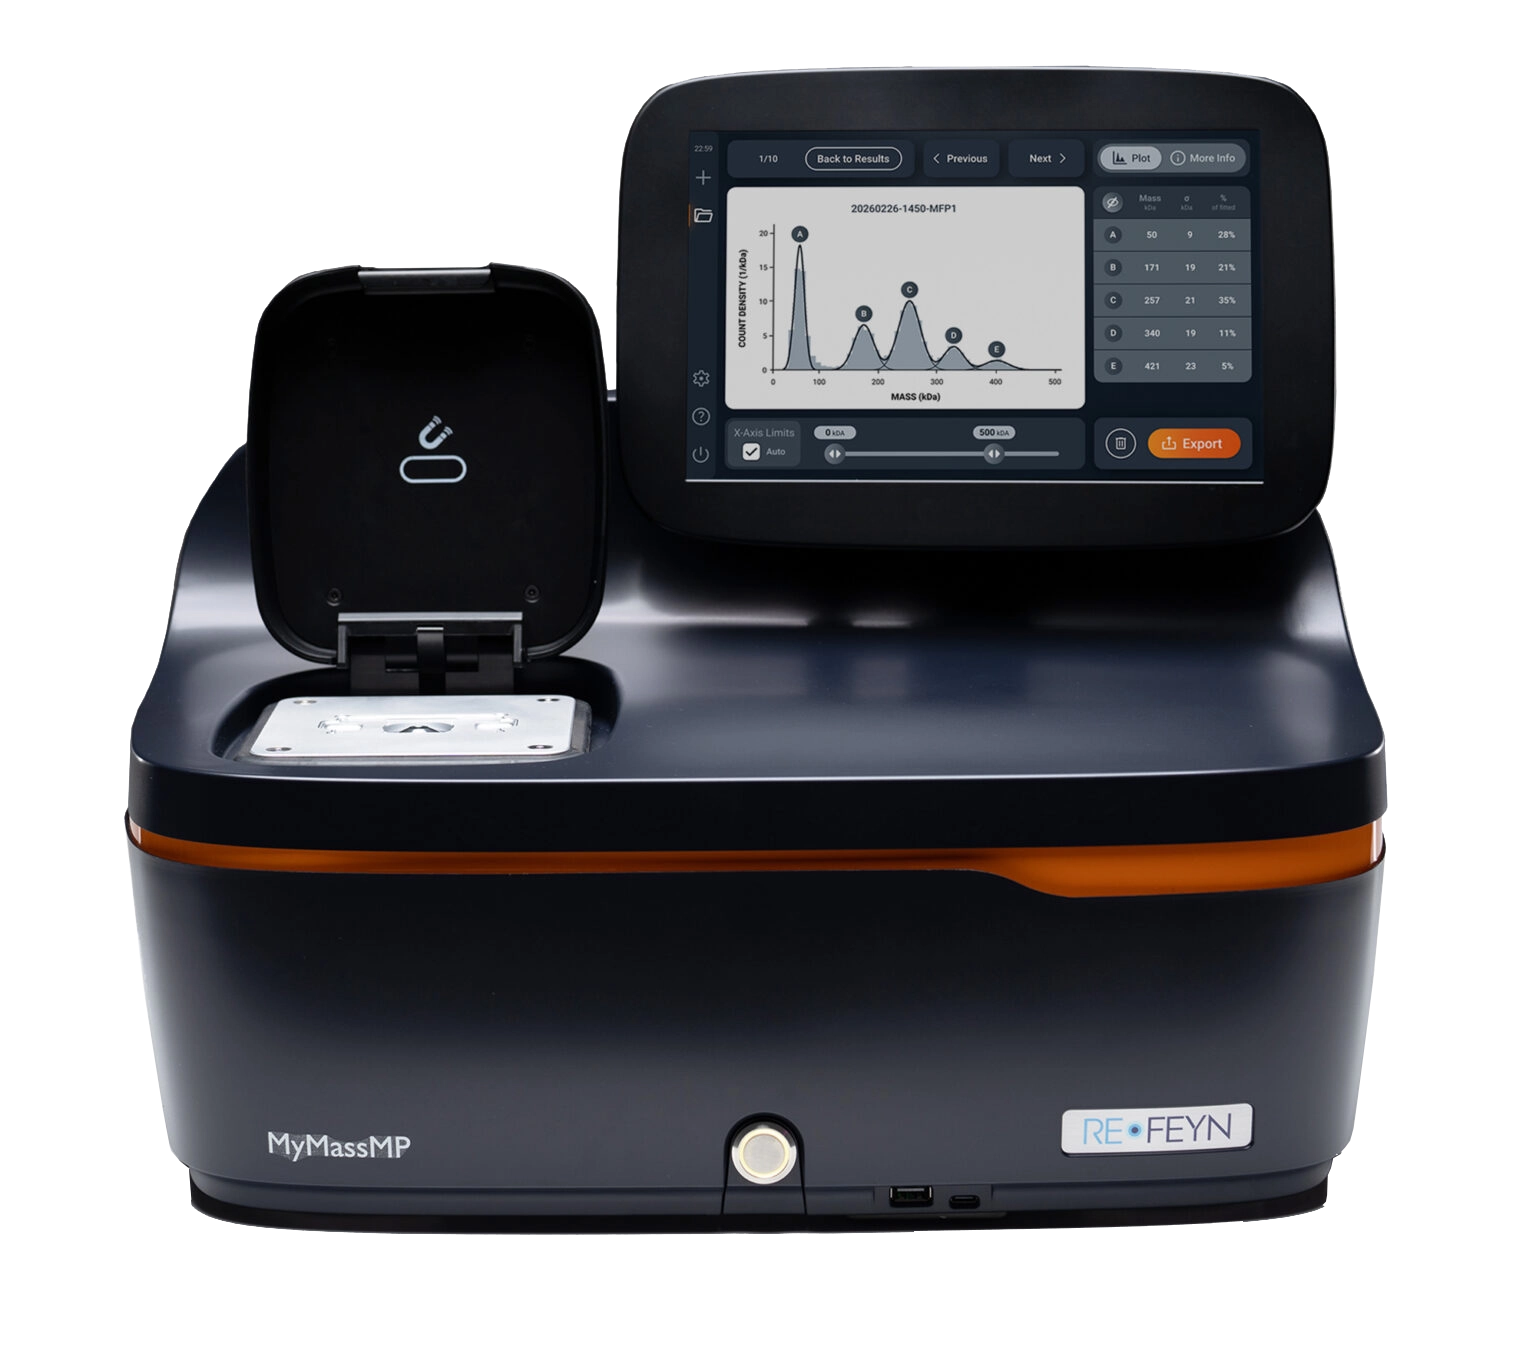
10 - Touchscreen Constraints
The instrument runs on an integrated touchscreen. Scientists use it with nitrile gloves on, in a busy lab, and cannot afford to restart an experiment because of a mis-tap. Anything based on hover, right-click, or precise pointing had to be rethought.
Every interaction had to be visible, tappable, or triggered some other way.
Large hit targets and generous spacing prevent the wrong tap with gloved fingers.
Any delay reads as failure. Users will tap again, and the instrument will register both.
The Principles, Applied
11 - High-fidelity Output
Interface and workflow examples
12 - Testing
Three rounds of testing on the hi-fi design: usability testing, alpha testing in real labs, and service testing.
8 participants, real touchscreens, gloves, task success, completion time, and error frequency.
3 institutions, 15 participants, 10 days, real workflows, and surveys.
6 service-team members testing workflows, wording, consumables, and recovery.
13 - What Changed
Reworked the workflow, added a QR code to instructional videos, and added stop/resume.
Reworded key instructions and added illustrations.
Added tagging and filtering on stored measurements.
Worked with Software to add a warning for abnormal unbinding events.
Worked with Operations on clearer instructions and labelling.
Clearer guidance for common errors and recovery paths.
Simplified cleaning instructions with Service.
Added FAQ pages based on questions from testing.
14 - Outcomes
I can't believe how easy this is to use. When can I order one for my lab?
Senior Scientist, King's College London

15 - Trade-offs
Simplicity
Reliability
Minimal training time
Scientific value
Affordability
Minimum cost, maximum margin
Sustainable manufacturing and logistics
Limited specs to avoid cannibalising the flagship
Hardware, consumables, and software developed in parallel
Timeline pressures and supply-chain delays
Limited time for internal testing
Success factor - constant alignment with Product Management, R&D, and Engineering enabled rapid pivots while keeping focus on core user value.
MyMass brought together research, hardware, software, consumables, service, and customer support into one coherent product experience.
By testing with real users and keeping Product Management, R&D, Engineering, Service, Operations, and Customer Excellence closely aligned, we were able to move from concept to a launch-ready instrument with confidence.
The product was successfully launched in April 2026, turning a complex scientific workflow into a more accessible way for labs to check samples before committing to expensive downstream techniques.
OTHER PROJECTS GLIMPSES